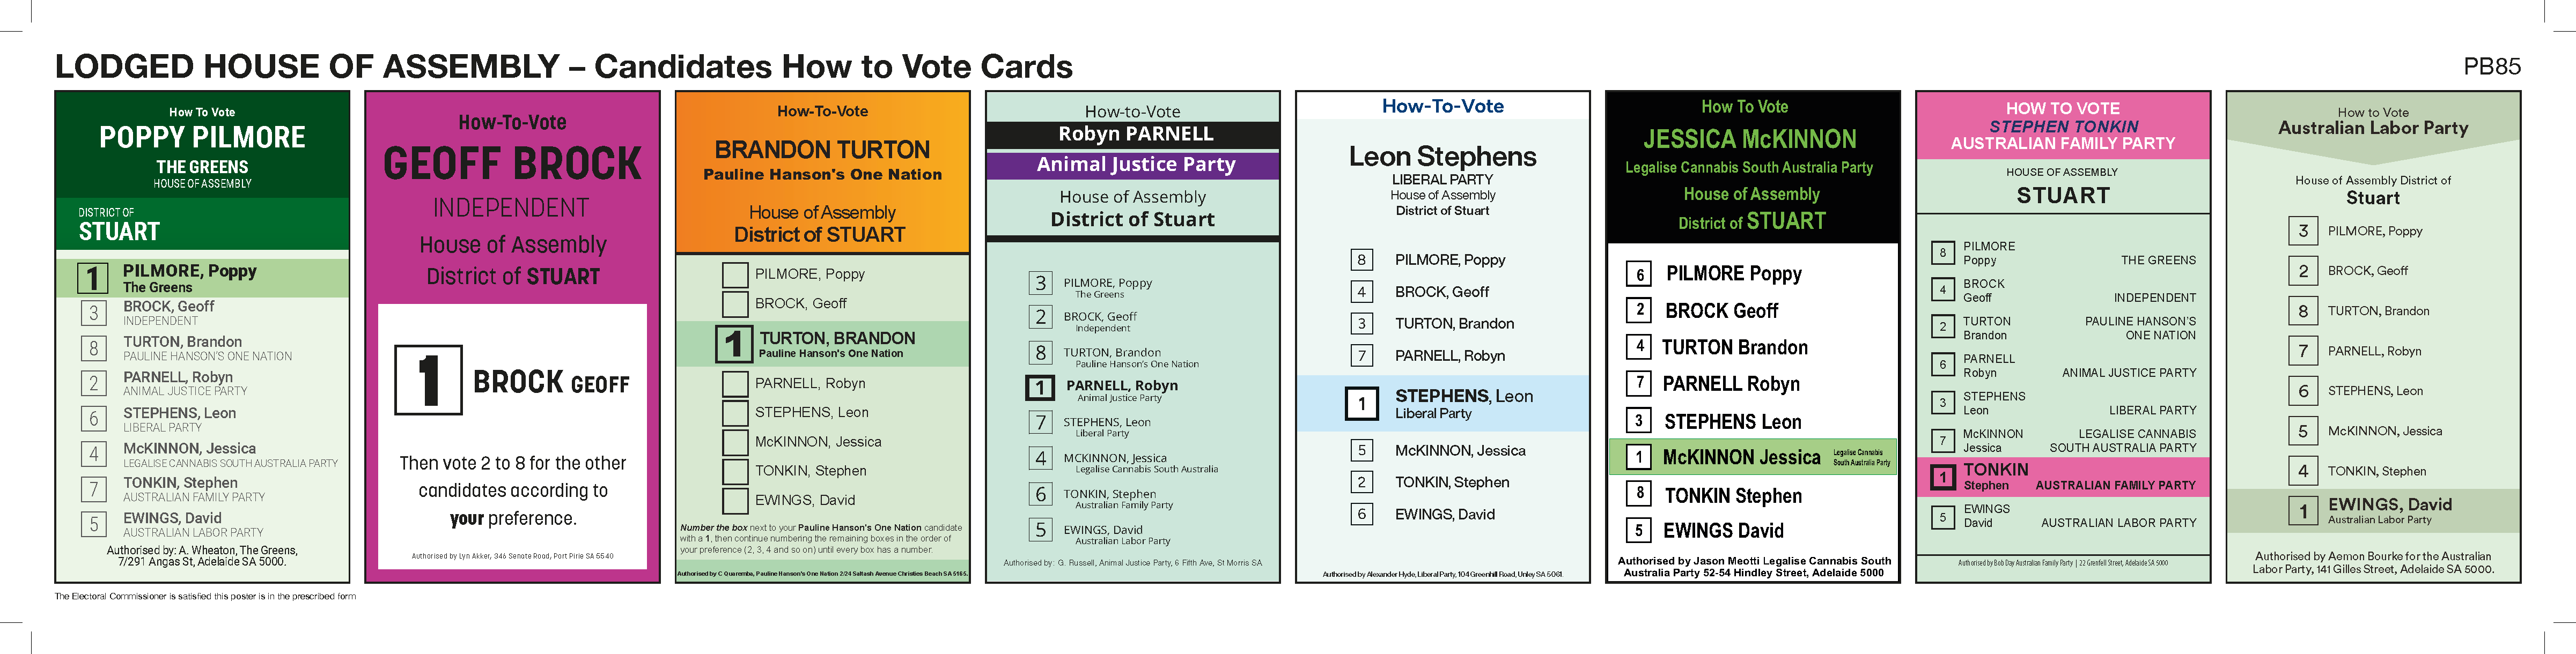
Elections
| District | Position | Candidate | Affiliation | Phone | Website | |
| Stuart | 1 | PILMORE, Poppy | THE GREENS | |||
| 2 | BROCK, Geoff* | INDEPENDENT | 0417502539 | |||
| 3 | TURTON, Brandon | PAULINE HANSON'S ONE NATION | ||||
| 4 | PARNELL, Robyn | ANIMAL JUSTICE PARTY | 0435339345 | |||
| 5 | STEPHENS, Leon | LIBERAL PARTY | 0882050255 | saliberal.org.au/team/leon-stephens | ||
| 6 | McKINNON, Jessica | LEGALISE CANNABIS SOUTH AUSTRALIA PARTY | lcsaparty.org.au | |||
| 7 | TONKIN, Stephen | AUSTRALIAN FAMILY PARTY | ||||
| 8 | EWINGS, David | AUSTRALIAN LABOR PARTY | 0884186700 | sa.alp.org.au |
How-To-Vote Vards (PDF)
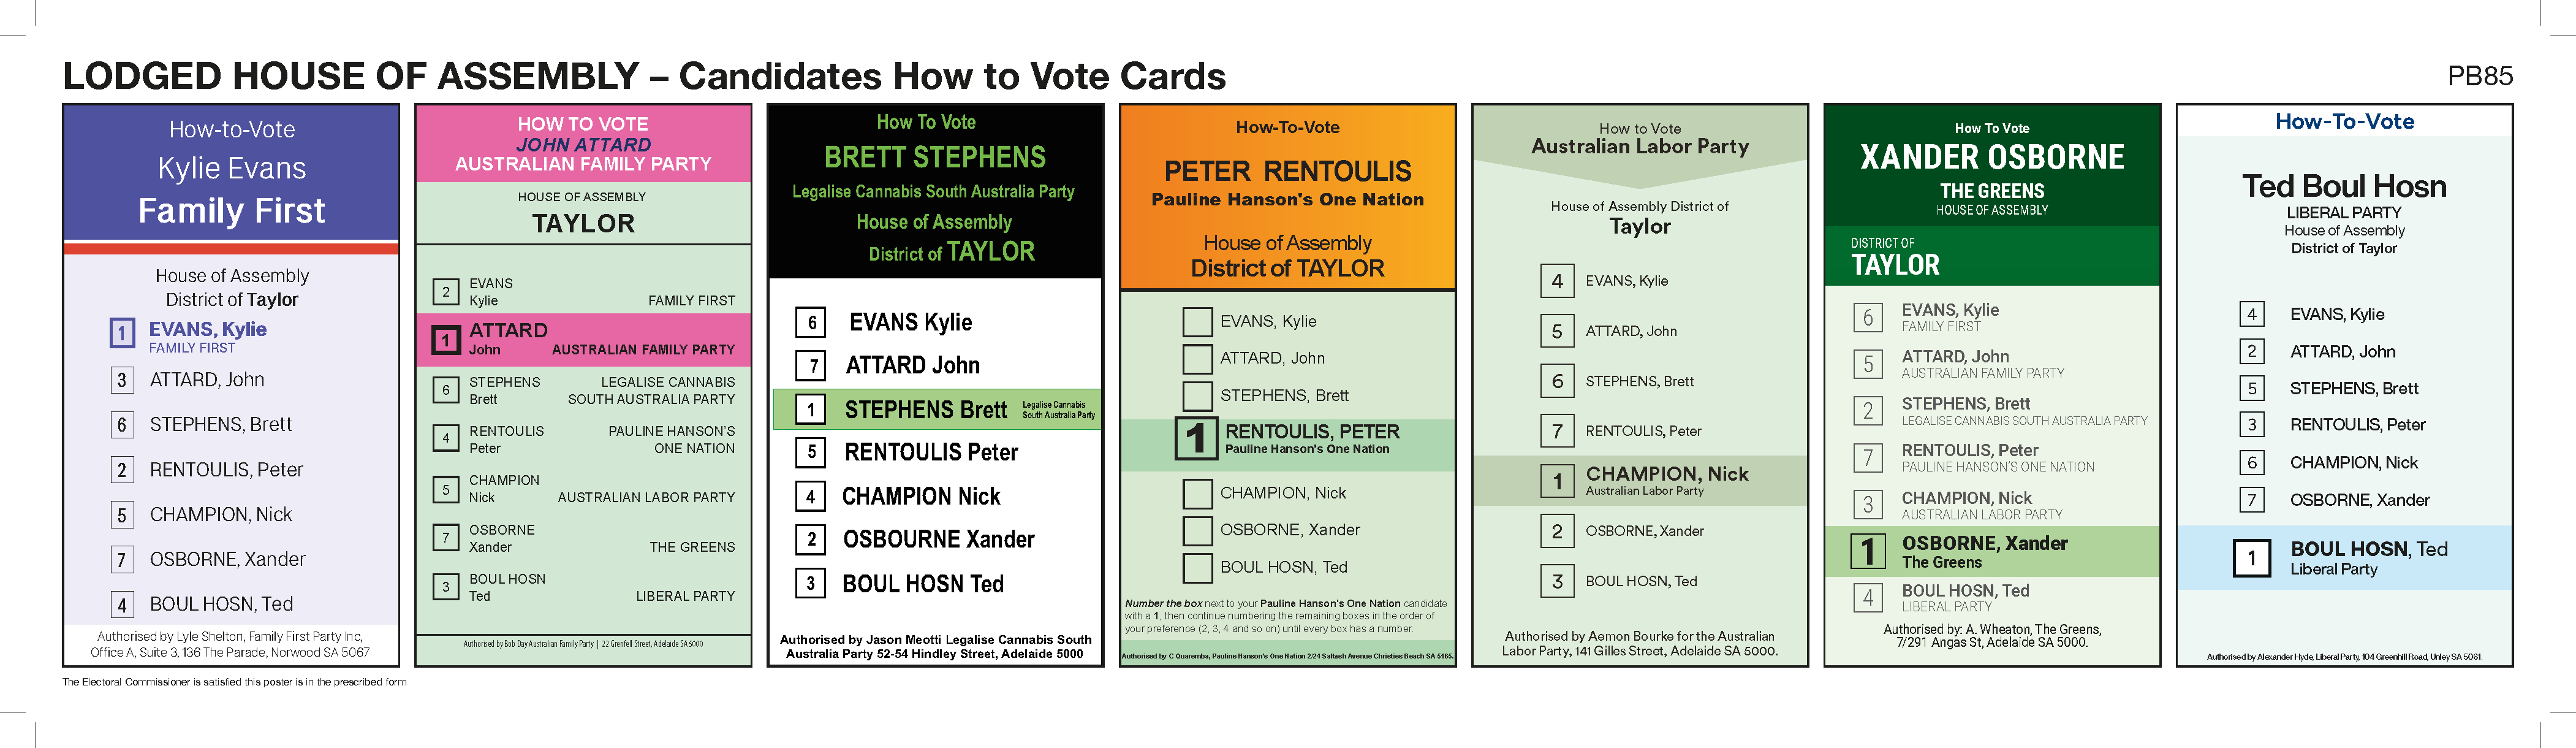
| District | Position | Candidate | Affiliation | Phone | Website | |
| Taylor | 1 | EVANS, Kylie | FAMILY FIRST | familyfirstparty.org.au | ||
| 2 | ATTARD, John | AUSTRALIAN FAMILY PARTY | ||||
| 3 | STEPHENS, Brett | LEGALISE CANNABIS SOUTH AUSTRALIA PARTY | lcsaparty.org.au | |||
| 4 | RENTOULIS, Peter | PAULINE HANSON'S ONE NATION | ||||
| 5 | CHAMPION, Nick* | AUSTRALIAN LABOR PARTY | 0882355580 | sa.alp.org.au | ||
| 6 | OSBORNE, Xander | THE GREENS | ||||
| 7 | BOUL HOSN, Ted | LIBERAL PARTY | 0882050255 | saliberal.org.au |
How-To-Vote Cards (PDF)
| District | Position | Candidate | Affiliation | Phone | Website | |
| Torrens | 1 | WARREN, Bradley | UNITED VOICE AUSTRALIA | 0438181754 | ||
| 2 | MEDLOCK, David | PAULINE HANSON'S ONE NATION | ||||
| 3 | YARA, Haritha | LIBERAL PARTY | 0882050255 | |||
| 4 | JOSHUA, Mervin | FAMILY FIRST | familyfirstparty.org.au | |||
| 5 | SPENCER, Meagan | AUSTRALIAN LABOR PARTY | 0884186700 | sa.alp.org.au | ||
| 6 | SALVEMINI, Stella | THE GREENS | ||||
| 7 | REYNOLDS, Malcolm | AUSTRALIAN FAMILY PARTY |
*Denotes sitting member
How-To-Vote Cards (PDF)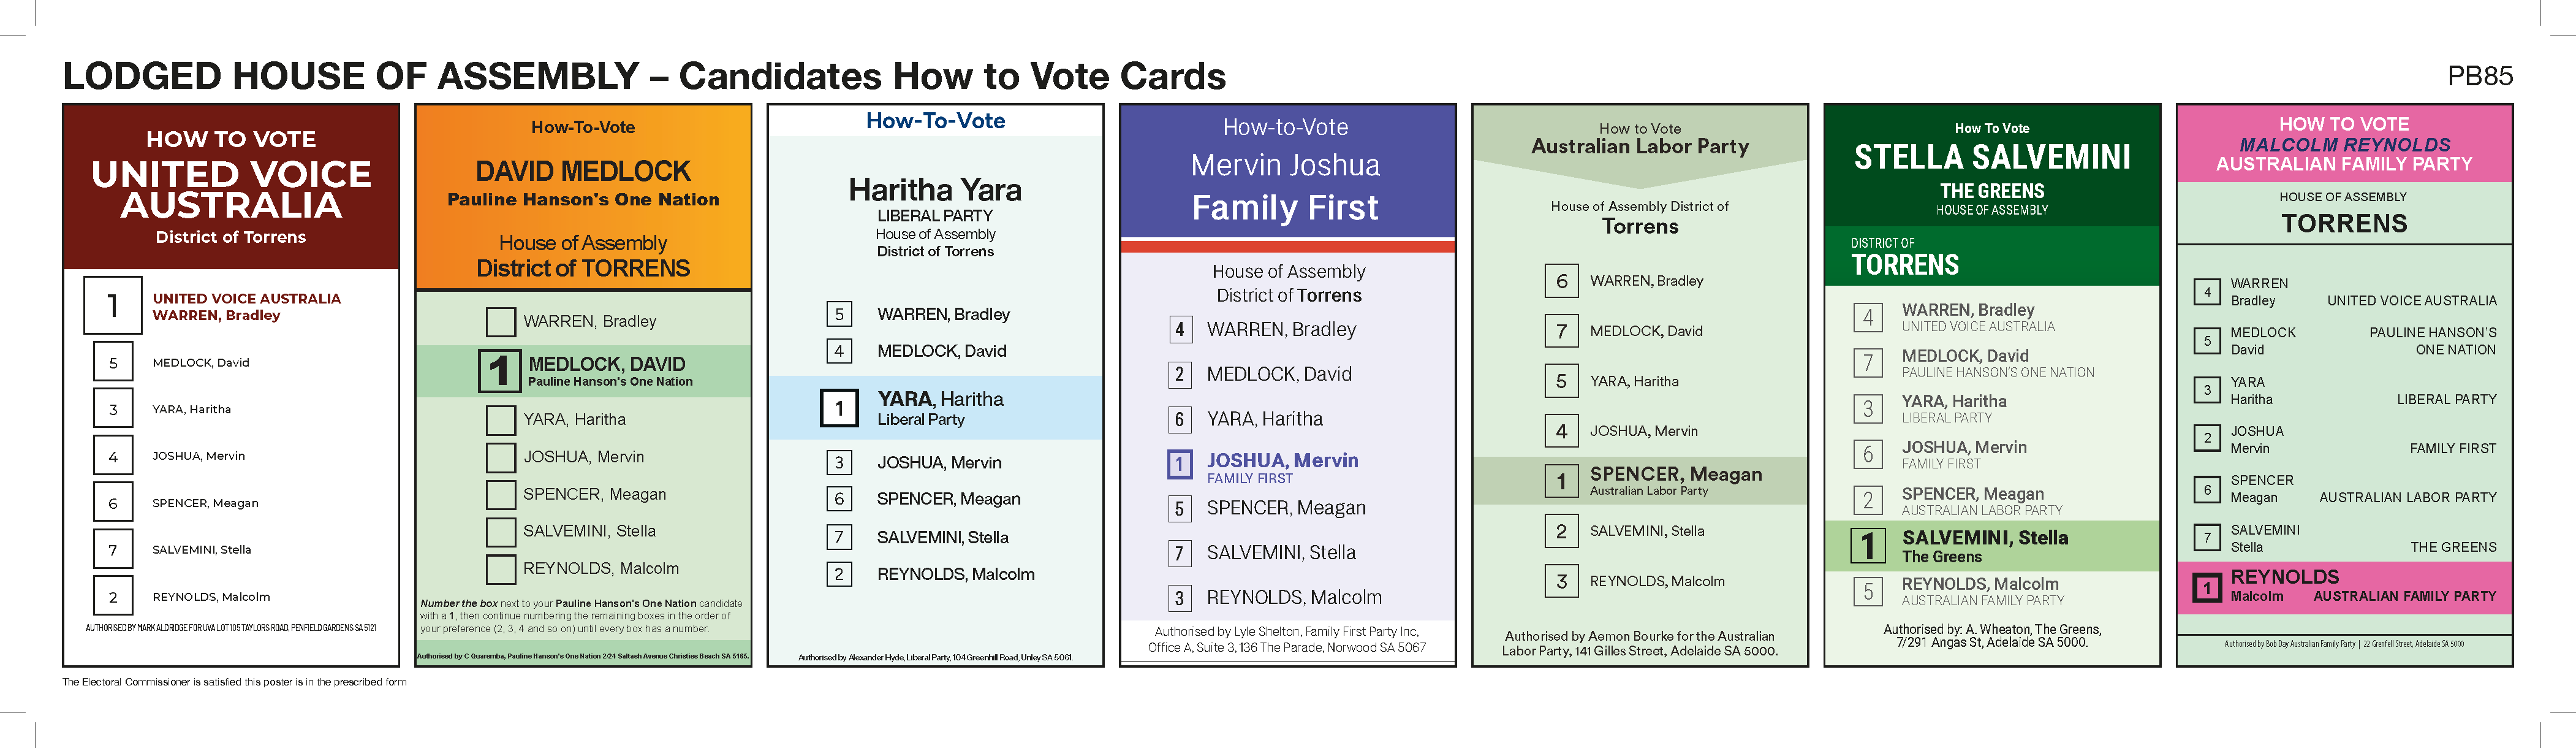
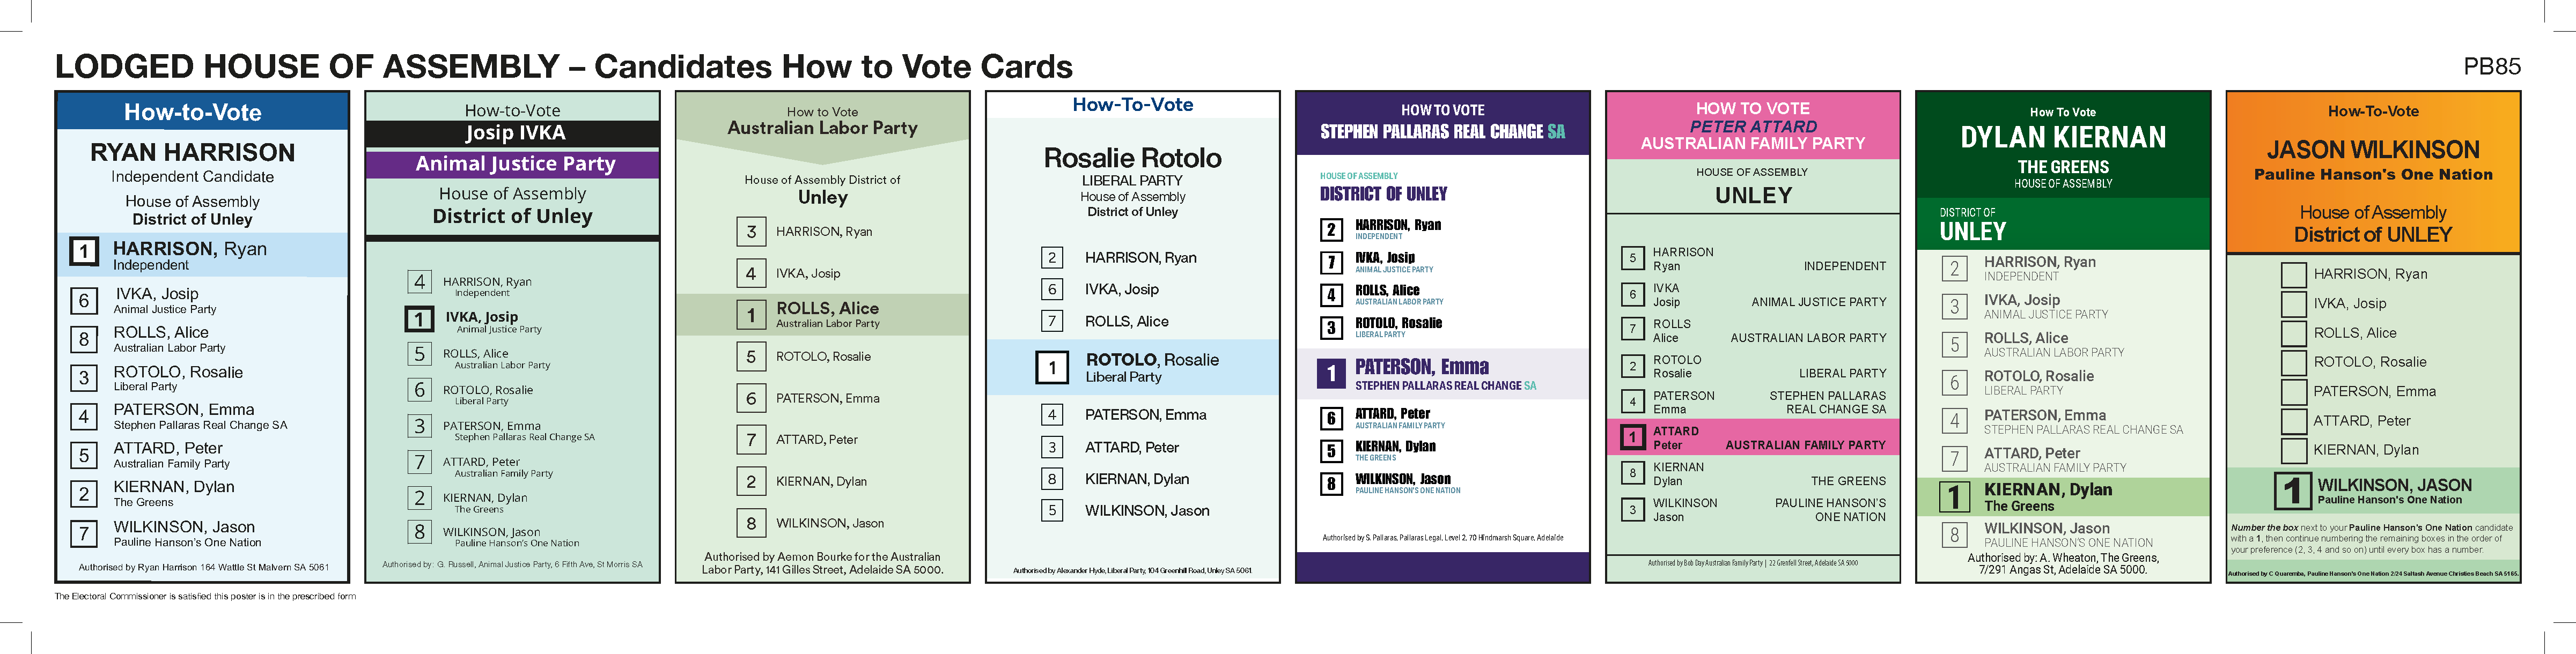
| District | Position | Candidate | Affiliation | Phone | Website | |
| Unley | 1 | HARRISON, Ryan | INDEPENDENT | 0404910000 | ryanharrison.com.au | |
| 2 | IVKA, Josip | ANIMAL JUSTICE PARTY | ||||
| 3 | ROLLS, Alice | AUSTRALIAN LABOR PARTY | 0884186700 | |||
| 4 | ROTOLO, Rosalie | LIBERAL PARTY | 0882050255 | saliberal.org.au/team/rosalie-rotolo | ||
| 5 | PATERSON, Emma | STEPHEN PALLARAS REAL CHANGE SA | www.stephenpallaras.com | |||
| 6 | ATTARD, Peter | AUSTRALIAN FAMILY PARTY | ||||
| 7 | KIERNAN, Dylan | THE GREENS | ||||
| 8 | WILKINSON, Jason | PAULINE HANSON'S ONE NATION |
How-To-Vote Cards (PDF)