Elections
Anangu Pitjantjara Yankunytjatjara (APY) - Executive Board Elections
Final results of the elections
|
Electorate |
|
Candidate Name (Elected candidate in bold) |
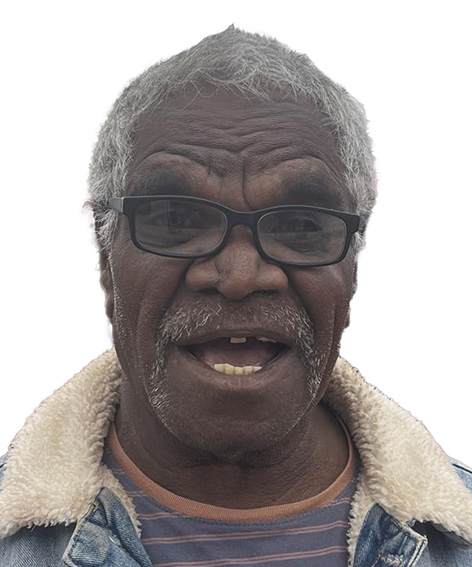
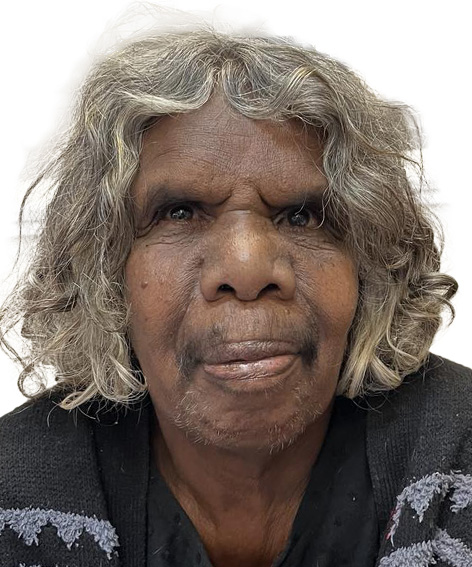
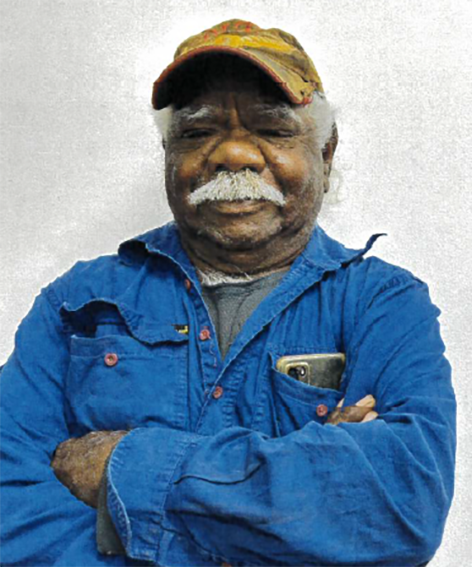
Photo of elected candidate |
Result |
No. of votes |
Total votes |
|
Pipalyatjara and Kalka |
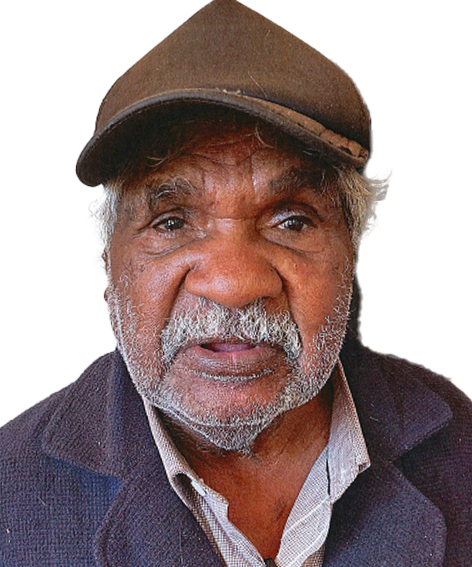
Male |
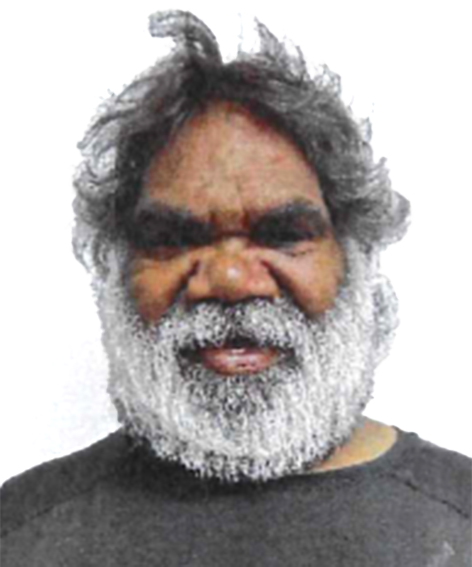
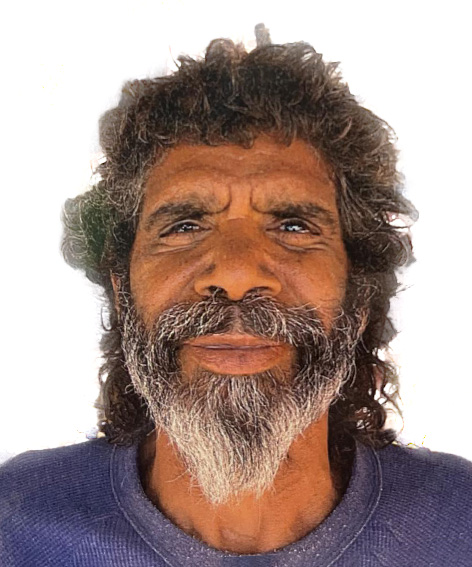
Bruce Williamson
Tony Paddy |
 |
ELECTED
|
28
17 |
45 |
|
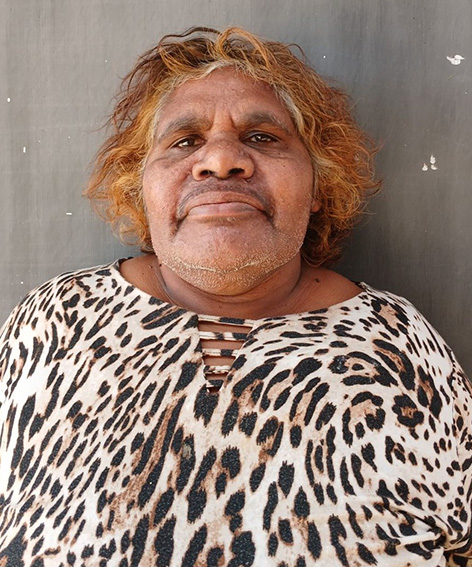
Female |
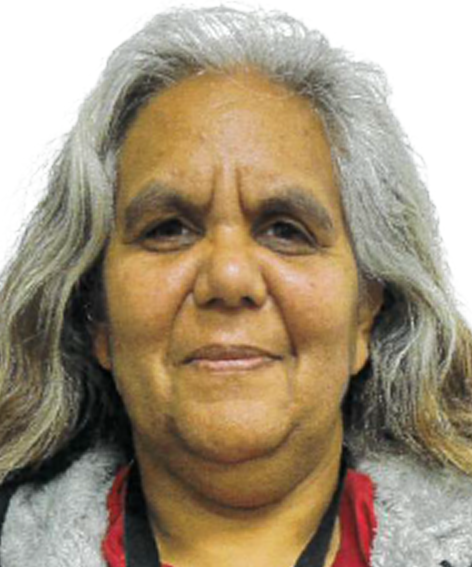
Yangi Yangi Fox
Renita Roberts |
 |
ELECTED
|
26
18 |
44 |
|
|
Kanpi, Nyapari, Angatja and Watarru |
Male |
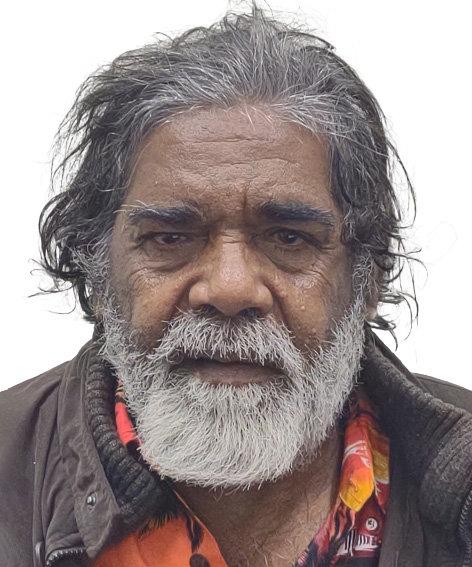
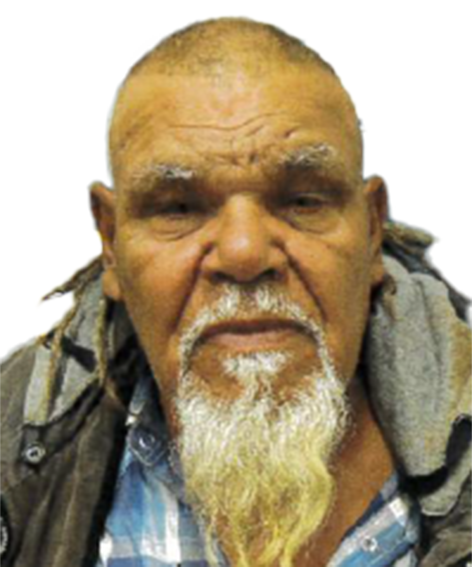
Charlie Anytjipalya |
 |
ELECTED UNOPPOSED |
||
|
Female |
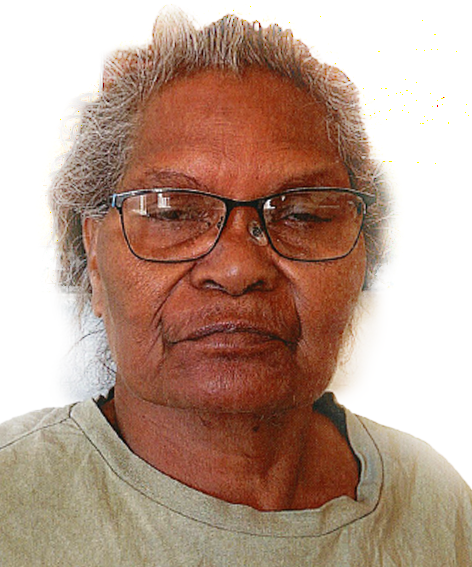
Marita Baker |
 |
ELECTED UNOPPOSED |
|||
|
Amata and Tjurma |
Male |
Owen Burton
Lee P Brady |
 |
ELECTED
|
31
15 |
46 |
|
Female |
Muna Kulyuru |
|
ELECTED UNOPPOSED |
|||
|
Kaltjiti, Irintata and Watinuma |
Male |
Kieran Roberts
Murray George
Arnie Frank |
 |
ELECTED
|
30
15
1 |
46 |
|
Female |
Langaliki Robin |
 |
ELECTED UNOPPOSED |
|||
| Pukatja, Yunyarinyi, Anilalya and Turkey Bore |
Male |
Jamie Minutjukur Nyaningu
Gary Lewis |
 |
ELECTED
|
48
44 |
92 |
| Female |
Eva Wells
|
 |
ELECTED
|
32 29
|
91 | |
| Mimili | Male |
Zibeon Fielding*
Willy Pompey * Due to a tie with both candidates receiving the same number of votes, the winner was determined by drawing of lots, as required by the legislation (APY Lands Rights Act 1981 Sch 3 cl 9(1)(c)). |
 |
ELECTED
|
35
35 |
70 |
|
Female |
Julieanne Campbell |
 |
ELECTED UNOPPOSED |
|||
|
Iwantja, Amuruna, Railway Bore, Witjintitja and Wallatinna |
Male |
Bernard Singer |
 |
ELECTED UNOPPOSED |
||
|
Female |
Tanya Singer
Karina Joan Lester |
 |
ELECTED
|
31
21 |
52 |
|
Enrolment: Closed on Wednesday 15 May 2024
Enrol to vote
On Wednesday 21 August 2024, you can vote for who will represent you on the APY Executive Board.
To vote, you must have your name on the electoral roll. Enrolment closed at 5pm on Wednesday 15 May 2024.
Enrolment criteria:
- must be Aṉangu,
- have your name on the electoral roll within your electorate; and
- be at least 18 years of age on polling day.
Check your enrolment
You can check your current electoral enrolment by entering your details on the AEC's website using the link below.
Enrol online
To enrol for the first time or get back on the roll, you can enrol online.
Update your enrolment details
Update online
When you move house, or if you change your name, you must update your details on the electoral roll. You can also update or correct other personal details.
Complete a paper form
To get a paper form, visit your nearest Aṉangu school or TAFE or download the fillable PDF and print.
If you fill out a paper form, you must return it by email to
Nominations: Closed on Wednesday 5 June 2024
Nominations
Ballot draw took place on the 31 July 2024 at 4pm - watch a recording on YouTube
Declaration of nominations
Nominations for the APY Executive Board Election closed on Wednesday 5 June 2024.
The following candidates are now declared eligible to stand for election and are shown in the order that they will be displayed on the ballot paper with voting occurring on Wednesday 21 August 2024.
|
Electorate |
Female Candidates |
Male Candidates |
| Pipalyatjara and Kalka | 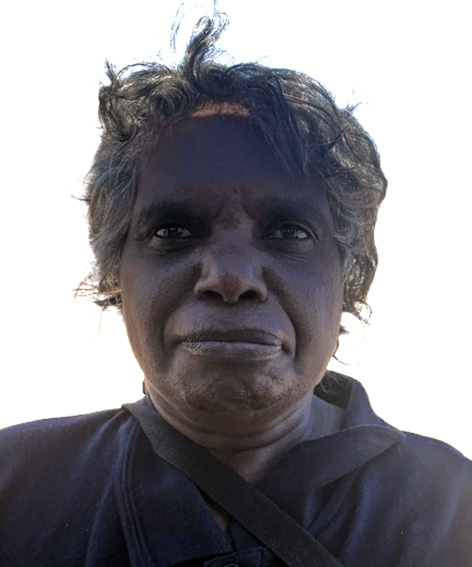 ROBERTS, Renita FOX, Yangi Yangi ROBERTS, Renita FOX, Yangi Yangi |
 PADDY, Tony WILLIAMSON, Bruce PADDY, Tony WILLIAMSON, Bruce |
|
Amata and Tjurma |
|
|
|
Kaltjiti, Irintata and Watinuma |
|
|
|
Pukatja, Yunyarinyi, Anilalya and Turkey Bore |
|
|
|
Mimili |
|
|
|
Iwantja, Amuruna, Railway Bore, Witjintitja and Wallatinna |
|
 BRADY, Lee P.
 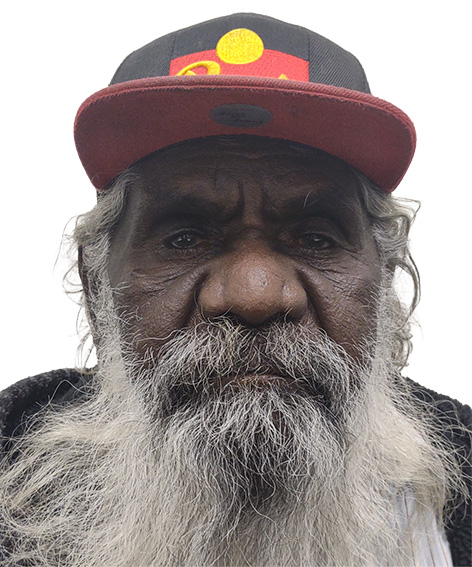 GEORGE, Murray
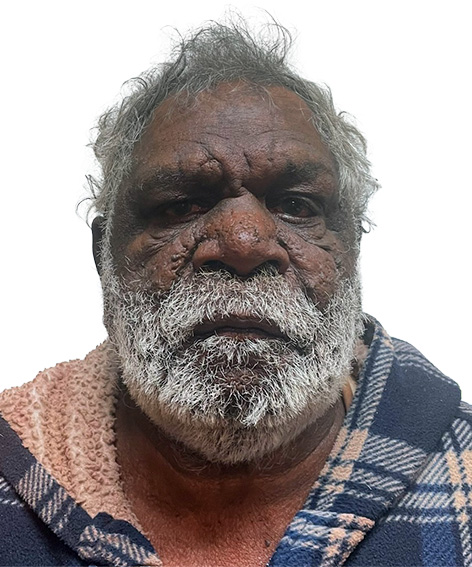 FRANK, Arnie
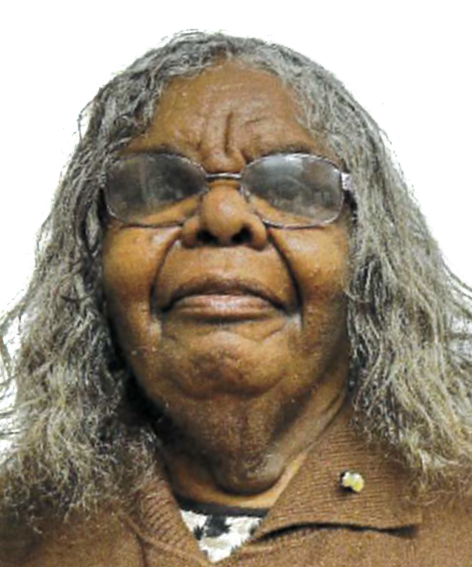 MINUTJUKUR, Makinti
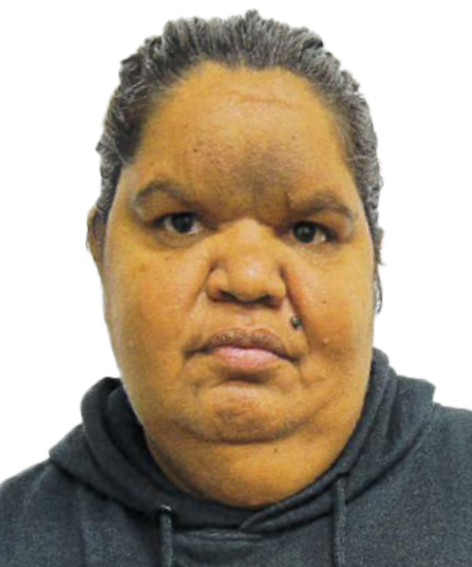 FRASER, Lorraine
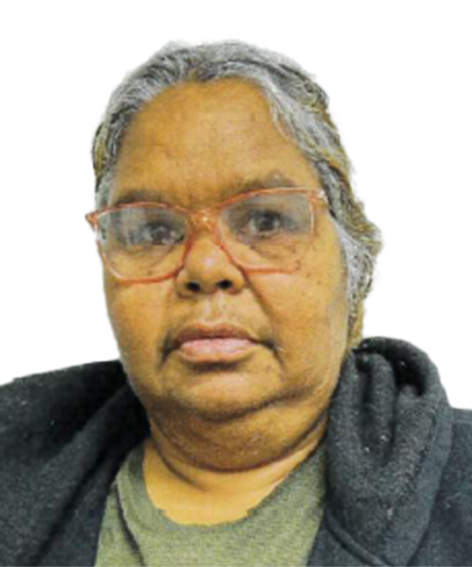 FRASER, Lois
 LEWIS, Gary
 POMPEY, Willy
 LESTER, Karina Joan
The following candidates have been declared elected to the relevant office as they were the only nominations declared for the relevant office.
|
Electorate |
Female Candidates |
Male Candidates |
|
Kanpi, Nyapari, Angatja and Watarru |
|
|
|
Amata and Tjurma |
|
|
|
Kaltjiti, Irintata and Watinuma |
|
|
|
Mimili |
|
|
|
Iwantja, Amuruna, Railway Bore, Witjintitja and Wallatinna |
|
Voting: Wednesday 21 August 2024
Voting
To vote you must be enrolled.
Voting day for the 2024 APY Executive Board elections is Wednesday 21 August 2024. Voting will be open from 9:30am to 3pm Central Standard Time (CST).
When you vote you will choose one male and one female for your electorates.
Voting Locations
APY LANDS
- Pipalyatjara Aṉangu School
- Murputja Education Centre
- Amata Aṉangu School
- Fregon Aṉangu School
- Ernabella Aṉangu School
- Mimili Aṉangu School
- Indulkana Aṉangu School
- Umuwa Administration Centre
Voting will also be offered at various stages within the hours of 9.30am to 3pm (CST) at the following locations:
NORTHERN TERRITORY
Alice Springs Hospital
6 Gap Rd
THE GAP NT
PORT AUGUSTA
Australian Electoral Commission
Northern Gateway
Cnr Marryatt and Jervois St
PORT AUGUSTA SA
Lakeview Transitional Accommodation Centre
Buzzacott Close
Port Augusta SA
ADELAIDE
Royal Adelaide Hospital
Port Rd
ADELAIDE SA
Kanggawodli Caring House
16-22 Clements St
Dudley Park SA
Iwiri Aboriginal Corporation
1 Lipson St
Port Adelaide SA
Electoral Commission SA
Level 6, 60 Light Square
ADELAIDE SA
Other information:
Audio Files
| URGENCY – ON THE DAY (21 August) - pitjantjatjara | |
| URGENCY – ON THE DAY (21 August) | |
| LIVE SCRIPT 21 August - pitjantjatjara | |
| LIVE SCRIPT (21 August) | |
| LIVE SCRIPT (5 August – 20 August) - pitjantjatjara | |
| LIVE SCRIPT (5 August – 20 August) | |
| RADIO SCRIPT (5 August – 20 August) - pitjantjatjara | |
| RADIO SCRIPT (5 August – 20 August) |
Count summary
Scrutiny and count was conducted on Tuesday 23 July 2024.
| Enrolled voters | 4,009 |
|---|---|
| Envelopes returned | 1,088 |
| Envelopes accepted | 1,065 |
| Envelopes rejected | 23 |
| Voter participation | 1,088 (27.14%) of the total enrolment |
| Formal votes | 1,060 |
| Informal votes | 5 |
| Quota | 531 |
First preference votes
Below are the first preference votes received by the candidates in the order they appeared on the ballot paper.
| Candidate | Candidate Donations Return 1 | Candidate Donations Return 2 | First preference votes | Percent | Elected or Excluded |
| ISLE, John Barry | CDR1 | CDR2 | 655 | 61.79% | ELECTED |
| SANTUCCI, Ricardo Stephen | CDR1 | CDR2 | 405 | 38.21% | |
| Total | 1,060 |
Distribution of preferences - Final result
After the distribution of preferences, John Barry Isle was declared elected at 10:54am on Tuesday 23 July 2024.
To view the distribution of votes refer to the Scrutiny Sheet for 23 July 2024 (PDF 38KB).
Daily returns
Information for candidates
Candidate briefing session
Online by the Electoral Commission of SA
A briefing session for intending candidates was held online at 6 pm on Thursday 23 May 2024. Watch the recording
Acts and Regulations
The rules that govern council elections are set out in:
The Acts and Regulations should be read in conjunction with the Local Government Act 1999.
Candidate eligibility and ineligibility
You are eligible to be a candidate for election as a member of a council if you are:
- an Australian citizen
- at the time the electoral roll closes:
- enrolled in the council area you are contesting, or
- the nominee of a body corporate or a group that has its name on the voters roll for the council area
- left off the voters roll for the council area in error.
You are not eligible to be a candidate for election as a member of a council if you are:
- a member of an Australian Parliament; or
- an undischarged bankrupt or receiving the benefit of a law for the relief of insolvent debtors; or
- have been sentenced to imprisonment and are, or could on the happening of some contingency become, liable to serve the sentence or the remainder of the sentence; or
- are an employee of the council; or
- are disqualified from election by court order under the Local Government Act 1999.
You are not eligible to be a candidate for election as a member of a council if you:
- in the case of a supplementary election - are a member of another council; or
- in the case of any election - are a candidate for election as a member of another council
Candidate disclosure returns
A person who is a candidate for election to an office of a council must lodge the following returns with the Electoral Commissioner via the candidate portal.
CAMPAIGN DONATIONS RETURN
Candidates must lodge a campaign donations return with the Electoral Commissioner.
Candidates must lodge 2 returns:
For a supplementary election:
- the first campaign donation return must be lodged with the returning officer in the period between 8 to 14 days after the close of nominations
- the second campaign donation return must be lodged within 30 days after the conclusion of the election.
The return must disclose:
- the total amount or value of all gifts received during the disclosure period
- the number of people who made those gifts
- the amount or value of each gift
- the date on which each gift was made
- details of persons and organisations (donors) providing those gifts.
The campaign donations return need not set out any details in respect of:
- a private gift made to the candidate
- a gift with an amount or value less than $500
- a gift already disclosed in a large gift return
If a candidate is not required to provide any details in a return, the campaign donations return must still be lodged and include a statement to the effect that no gifts of a kind required to be disclosed were received.
LARGE GIFTS RETURN
All candidates must lodge a large gifts return if they receive a gift or gifts from a donor in excess of $2,500.
The Acts prescribe different times that the large gifts return must be lodged, but during the election year, a large gift return must be lodged within 5 days of receipt of the large gift.
The return must disclose:
- the amount or value of each gift received
- details of persons and organisations (donors) providing those gifts
- the date on which each gift was made.
Two or more gifts (excluding private gifts) made by the same person to a candidate during the disclosure period are to be treated as one gift.
A large gifts return need not set out any details in respect of a private gift made to the candidate. A gift to a candidate is a private gift if it is made in a private capacity to the candidate for their personal use and the candidate has not used, and will not use, the gift solely or substantially for a purpose related to the election.
Large gifts returns should be lodged with ECSA at
Offences
See section 85 of the Local Government (Elections) Act 1999. It is an offence to fail to lodge a return within time, to lodge a return containing false or misleading information, or to supply information that is false or misleading to another person for a return. The maximum penalty is $10,000.
Public inspection of returns
The Electoral Commissioner is required to publish all returns within prescribed times on a website maintained by the returning officer.
Records
See section 89 of the Local Government (Elections) Act 1999. A person must take reasonable steps to retain all records relevant to a return and keep these for at least 4 years after the date of which the relevant return is required to be lodged. The maximum penalty is $5,000.
 Frequently asked questions
ALL COUNCILS (other than the City of Adelaide)
What returns do I have to lodge?
- 2 campaign donation returns – whenever a gift (or multiple gifts from the same donor) is received that totals $500 or more
- Large gift return - whenever a gift (or multiple gifts from the same donor) is received that totals $2,501 or more.
Where do I lodge my returns?
Copies of the disclosure returns for lodgement by candidates are available in the candidate portal under disclosure returns. Each completed return can be lodged on the portal during the allotted time that they are due; these dates are shown in the portal. If you are unable to lodge these via the candidate portal, please contact
Is there a difference between 'gift' or 'donation?'
The Act refers to a ‘gift’, but it effectively means the same as a ‘donation’.
A gift is defined in the Local Government (Elections) Act 1999 (LGEA) as:
- a disposition of property
- made by a person to another person (otherwise than by will)
- without consideration in money or money’s worth or with inadequate consideration; and
- includes the provision of a service (other than volunteer labour) for no consideration or inadequate consideration.
By way of example, if a person gives money to a candidate (without getting anything in return), donates goods or services, or supplies a good or service to a candidate for less than the market or commercial rate, this may constitute a gift.
What is a 'disposition of property?'
A ‘disposition of property’ means a conveyance, transfer, assignment, settlement, delivery, payment or other alienation of property, and includes:
- the allotment of shares in a company; and
- the creation of a trust in property; and
- the grant or creation of a lease, mortgage, charge, servitude, licence, power or partnership or any interest in property; and
- the release, discharge, surrender, forfeiture or abandonment, at law or in equity, of a debt, contract or chose in action or any interest in property; and
- the exercise by a person of a general power of appointment of property in favour of another person; and
- a transaction entered into by a person with intent thereby to diminish, directly or indirectly, the value of the person's own property and to increase the value of the property of another person.
What do I have to disclose in a campaign donation return?
The form of return will be provided in the candidate portal with fillable fields to complete, including:
- the total amount or value of all gifts with an amount or value of $500 or more received by the candidate during the disclosure period
- the number of persons who made the gifts
- the amount or value of each gift
- the date on which gift was made
- the name and address of the person making the gift (or if a trust or incorporated association – the name of the association and the name and addresses of the executive committee of the association and the name and address of the trustees and title and description of the trust).
What do I have to disclose in a large gift return?
The form of return will be provided in the candidate portal with fillable fields to complete, including:
- the amount or value of each gift
- the date on which the gift was made
- the name and address of the person making the gift (or if a trust or incorporated association – the name of the association and the name and addresses of the executive committee of the association and the name and address of the trustees and title and description of the trust).
When do I have to lodge these returns?
Candidates must lodge a campaign donations return with the Electoral Commissioner.
Candidates must lodge 2 returns:
For a supplementary election:
- the first campaign donation return must be lodged with the returning officer in the period between 8 to 14 days after the close of nominations
- the second campaign donation return must be lodged within 30 days after the conclusion of the election.
Who is a candidate?
A person is a candidate if they have announced their candidacy for an election, if they have nominated as a candidate for an election, or if they are already a member of council standing for election again.
What is a 'new candidate?'
A person is defined as a ‘new candidate’, in relation to an election, if the person had not been a candidate in the last general election of a council and had not been a candidate at a supplementary election held after the last general election of a council.
Do I have to report the same campaign donation (i.e. gift) more than once?
No. Although the disclosure period (reporting period) for the second campaign donation return is the same as for the first campaign donation return, gifts already reported in the first campaign donation return do not need to be disclosed again.
What if I receive 2 or more gifts from the same donor?
There is a requirement to treat 2 or more gifts during the disclosure period as 1 gift, and once the total reaches $500 (for a campaign donation) or $2,501 (for a large gift), that ‘gift’ will be disclosed in the relevant campaign donation return or large gift return.
What if I do not receive any donations or any donations over $500? Do I still need to lodge both campaign donation returns?
Yes. You should lodge a NIL return for both.
What if I have already reported a gift received in a large gift return? Do I have to report it again in a campaign donation return?
No. You do not need to report a large gift in a later campaign donations return, if it has already been disclosed.
How do I know if something I give to a candidate needs to be disclosed?
If it is a private gift, it does not need to be disclosed. A gift is a private gift if it is made to a candidate in a private capacity for their personal use and the candidate has not used and will not use the gift solely or substantially for a purpose related to the election.
Do I have to disclose the use of volunteers as a gift?
No. Whilst the definition of a gift includes the provision of a service, volunteer labour is excluded.
Are there any other restrictions on the provision of a gift to a candidate?
Gifts to candidates are permissible, as long as they are appropriately disclosed (where required) by the candidate. Although the provision of a gift is not an illegal practice, candidates and others are subject to the requirements of s57 of the LGEA which provides that a person who offers or gives a bribe with a view to inducing a person to submit or withdraw candidature, influence votes or otherwise interfere with the election if guilty of an offence.
A bribe includes any pecuniary sum or material advantage including food, drink or entertainment where the value is equal to or more than $20.
It should be noted that it is unlawful to receive a gift of $500 or more unless the required details (name, address, etc) to identify the donor are obtained by the candidate. Records should be kept by the candidate.
What if I do not receive any donations over $2,500? Do I still need to lodge a NIL large gift return?
No. You do not need to lodge a large gift return unless you receive a gift (or gifts from the same donor) over $2,500.
Where do I find further information?
- Part 14, ss 80-90 of the Local Government (Elections) Act 1999
- Regulation 11A of the Local Government (Elections) Regulations 2010
Information is current as of 13 January 2023.
Disclaimer: The information provided in this FAQ guide is general in nature. Candidates and others should refer to the specific wording of the Act and Regulations and seek independent legal or other advice on any issues of interpretation that may arise.
Candidate responsibilities
As a candidate, you have a range of important responsibilities and obligations under the law. These include making sure all electoral material you publish contains the proper authorisation statement, and that the material is not inaccurate and misleading.
View the electoral advertising page for more information.
All candidates, whether successful or not, must lodge disclosure returns.
Electoral advertising
There are restrictions placed on advertising during, and outside of, an election period. These are contained within Part 7 of the Local Government (Elections) Act 1999. The Electoral Commission SA is unable to provide advice on the interpretation of these provisions. Therefore, if you are in doubt about the interpretation, we recommend you seek independent legal advice.
Learn more on our electoral advertising page.
Forms and handbooks
- Campaign donation return LG2 (PDF, 829KB)
- Candidate handbook LG20 (PDF, 1MB)
- Large gifts return LG52 (PDF, 232KB)
- Profile and photograph requirements LG13 (PDF, 735KB)
- Scrutineer authority LG15 - (PDF, 258KB)
- Scrutineer guide LG14 - (PDF, 528KB)
- Understanding the role of a councillor (PDF, 2.4MB)
- Voters roll - Acknowledgment of use LG55 (PDF, 236KB)
Nominating as a candidate
Nominations open on Thursday 23 May 2024 and close at 12 noon Thursday 6 June 2024.
Nominations are to be completed online through the candidate portal.
Candidates must submit a profile of not more than 1000 characters with their nomination and may also provide a photograph, predominantly head and shoulders, taken within the previous 12 months.
Find out more about what it's like to be a member of council.
Responsibilities as a member of a council
Councils are responsible for many of the services that make South Australia such a great place to live and work, including libraries, playgrounds, sporting facilities and rubbish and recycling.
Becoming a councillor or mayor means you will help shape a wide range of policies and decisions that will impact the short and long-term future of your local community.
More information can be found on the council elections website.
Enrolment
The electoral roll for the supplementary election closes at 5 pm on Tuesday 30 April 2024.
If you are correctly enrolled for state elections in South Australia, you are automatically included on the council voters roll and will receive ballot papers through the post.
If you need to check or update your enrolment for future elections, you can choose one of the following options:
- Check my enrolment
- Enrol online (first time voters or to get back on the roll)
- Update my details online (for updates to your address, name or other contact details)
Council supplementary roll
If you are not enrolled on the state electoral roll you may be eligible to register on the council supplementary roll if you are:
- a resident or a non-Australian citizen who has lived at your residential address for one month or more
- an owner of an organisation or business
- an owner of a holiday home
- a sole owner, or group of owners, of a rateable property
- a sole occupier, or group of occupiers, of a rateable property
- a landlord of rateable property.
In accordance with section 15(5a) of the Local Government (Elections) Act 1999, council must purge the council's supplementary roll on 1 January of every election year. Therefore, all landlords, organisations, business owners or occupiers, and resident non-Australian citizens, must re-enrol from January 1 of every election year to be eligible to vote, with the exception of the City of Adelaide.
If you are unsure whether you are enrolled on the council supplementary roll, contact your local council.
List of candidates
In accordance with the Local Government (Elections) Act 1999, a draw to determine the order of candidate names to appear on the ballot paper was held at 2pm on Thursday 6 June 2024. Profiles for each of the 2 candidates are displayed below in the same order as their names appear on the ballot paper. This information has been provided by the candidate and neither the Returning Officer nor the Lower Eyre Council take responsibility or bear liability for the content contained within.
Lower Eyre Council – Area Councillor

ISLE, John Barry
I have lived on the Eyre Peninsula for the last 25 years and in Coffin Bay for almost 3 years. My wife Jodie and I have been married for 20+ years and have two boys aged 18 and 15. I have always worked in the fishing industry since leaving home at 16, and it has taken me around the world, up and down the East and West coast of Australia, in roles as diverse as pearl diving in Broome, to now owning Coffin Bay cockle quota. I am employed as the General Manager of a farming operation for the largest fishing company operating on the Eyre Peninsula. I have conservative values and am a firm believer in free enterprise and the need to invest in communities to ensure their growth and success. With my vast experience in business, proactive character and knowledge of the local area, I look forward to the opportunity to build relationships with members of the community and to deliver positive outcomes to our Lower Eyre Peninsula region.
I live in the area | Contact Details:
Campaign Donations 1

SANTUCCI, Ricardo Stephen
I am married with two grown children My Wife Trish and i have now moved to Poonindie to be closer to our daughter and grand children I have now retired from my position as OCC Health manager and Senior Advisor for injury Management and Emergency Services at GFG Whyalla. I also was luckily enough to be an elected Councillor for three terms and Deputy Mayor twice. I am looking to be a part of my new community and hopefully add some of my experiences I did also spent time on the hospital board and show committee for many years as well as hold the position of unit manager of the SES for some years. Written and authorised by Rick Santucci.
I live in the area | Contact Details: 0408 805 741 | I am not a member of a Political Party
Campaign Donations 1
Campaign Donations 2
Voting
Voting in council elections is conducted by post. All election materials, including your ballot paper, are mailed directly to the postal address you provide on the electoral roll.
Ballot packs
Automatic ballot pack mail out: Tuesday 25 June to Monday 1 July 2024.
Ballot packs contain:
- a ballot paper for the election
- candidate profiles
- a ballot paper envelope (you must sign this envelope, as the elector, to ensure ballot security)
- a reply-paid envelope
- a postal voting guide
Completing your ballot papers
To make a formal vote, you must number at least as many boxes as there are vacancies, in the order of your choice.
For this election, you must place the number 1 in the candidate square on the ballot paper for the person you want as your first choice. If you wish, you may continue to number some or all of the other boxes (starting with the number 2).
Directions on how to vote are shown on the ballot paper. Make sure you view the candidate profiles to make an informed decision.
Returning your ballot papers
Follow these steps after completing your ballot paper:
- Place your folded ballot paper in the ballot paper envelope provided.
- Seal the ballot paper envelope.
- Ensure the relevant declaration is completed with your details and signed.
- Place your sealed ballot paper envelope in the reply-paid envelope and seal it.
- Mail the reply-paid envelope so that it reaches the returning officer before 12 noon on Monday 22 July 2024.
Requesting a replacement pack
If you haven't automatically received your ballot material by Monday 8 July 2024, and you believe you are entitled to vote, please contact ECSA on 1300 655 232.
The deadline you can apply for replacement voting material is 5 pm on Monday 15 July 2024.
You can request a replacement ballot pack if you have been left off the roll in error, or the original material was:
- not received
- destroyed or lost
- spoiled
Telephone-assisted
Telephone-assisted voting is a special service available for voters in the following categories:
- If you are blind or have low vision
- If you are interstate or overseas during the voting period.
Dedicated call centre
Telephone-assisted voting will be available during the hours listed below.
|
Dates |
Times |
|
Thursday 18 July - Friday 19 July 2024 |
9:00 am to 5:00 pm |
|
Monday 22 July 2024 (close of voting) |
9:00 am to 12:00 pm |
Preparing to vote by telephone
Consider your vote
- Review the candidates and their profiles and decide your choices before making your call
- List the candidates in order of your choice so you can relay this to the voting assistant who will mark the ballot paper accordingly.
Telephone-assisted voting method
- Contact the call centre on one of the numbers below to speak to an ECSA representative
- 1300 655 232 within South Australia only
- 08 7424 7400 from interstate
- +61 8 7424 7400 from overseas
You will be asked to verify your identity and your entitlement to vote. Your call will then be transferred to a voting assistant, who will take your vote.
Timetable
| Event | Legislation* | Date |
|
Close of rolls |
s 6(7)(a), s 15(9)(b) |
5 pm, Tuesday 30 April 2024 |
|
Nominations open |
s 19(4) |
Thursday 23 May 2024 |
|
Online candidate briefing session |
6 pm, Thursday 23 May 2024 | |
|
Nominations close |
s 23(b) |
12 noon, Thursday 6 June 2024 |
|
Draw for positions on the ballot paper |
s 29(3)(b) |
2.00pm Thursday 11 July 2024 |
|
First campaign donation return due |
s 80(3)(a)(ii) | Thursday 13 June 2024 to Thursday 20 June 2024 |
|
Mailout of materials |
s 39(1) |
Tuesday 25 June 2024 to Monday 1 July 2024 |
|
Last day for re-issue of voting materials |
s 39(4), s 43(4) | 5 pm, Monday 15 July 2024 |
|
Close of voting (polling day) |
s 6(6), s 6(7)(b) | 12 noon, Monday 22 July 2024 |
|
Scrutiny and count |
s 47(1)(a) | Tuesday 23 July 2024 |
| Second campaign donation return due | s 80(3)(b) |
Within 30 days of the 'conclusion of the election' |
Count summary
Scrutiny and count was conducted on Tuesday 23 July 2024.
| Enrolled voters | 2,614 |
|---|---|
| Envelopes returned | 1,154 |
| Envelopes accepted | 1,130 (1 envelope did not contain a valid ballot paper) |
| Envelopes rejected | 24 |
| Voter participation | 44.15% of the total enrolment |
| Formal votes | 1,125 |
| Informal votes | 4 |
| Quota | 563 |
First preference votes
Below are the first preference votes received by the candidates in the order they appeared on the ballot paper.
| Candidate | Candidate Donations Returns | First preference votes | Percent | Elected or Excluded |
| DENTON, Gavin | CDR1 CDR2 | 251 | 22.31% | EXCLUDED |
| HATCH, Karin | CDR1 CDR2 | 528 | 46.93% | ELECTED |
| GROCKE, Shane | CDR1 CDR2 | 346 | 30.75% | |
| Total | 1,125 |
Distribution of preferences - Final result
After the distribution of preferences, Karin Hatch was declared elected at 2.45pm on Tuesday 23 July 2024.
To view the distribution of votes refer to the Scrutiny Sheet for 23 July 2024 (PDF 38KB).
Candidates declared
Nominations opened on Thursday 23 May 2024 and closed at 12 noon Thursday 6 June 2024. In accordance with the Local Government (Elections) Act 1999, a draw to determine the order of candidate names to appear on the ballot paper was held at 2pm on Thursday 6 June 2024. The result of the draw are detailed below.
Daily returns
District Council of Yankalilla – Councillor for Light Ward

GROCKE, Shane
Timetable
| Event | Legislation* | Date |
|
Close of rolls |
s 6(7)(a), s 15(9)(b) |
5 pm, Tuesday 30 April 2024 |
|
Nominations open |
s 19(4) |
Thursday 23 May 2024 |
|
Online candidate briefing session |
6 pm, Thursday 23 May 2024 | |
|
Nominations close |
s 23(b) |
12 noon, Thursday 6 June 2024 |
|
Draw for positions on the ballot paper |
s 29(3)(b) |
2.00pm Thursday 11 July 2024 |
|
First campaign donation return due |
s 80(3)(a)(ii) | Thursday 13 June 2024 to Thursday 20 June 2024 |
|
Mailout of materials |
s 39(1) |
Tuesday 25 June 2024 to Monday 1 July 2024 |
|
Last day for re-issue of voting materials |
s 39(4), s 43(4) | 5 pm, Monday 15 July 2024 |
|
Close of voting (polling day) |
s 6(6), s 6(7)(b) | 12 noon, Monday 22 July 2024 |
|
Scrutiny and count |
s 47(1)(a) | Tuesday 23 July 2024 |
| Second campaign donation return due | s 80(3)(b) |
Within 30 days of the 'conclusion of the election' |
The Declaration of nominations and draw for ballot paper positions was held at 3pm Friday, 1 March 2024, at the Returning Officer office.
The following table shows the list of candidates nominated for the House of Assembly district of Dunstan.
Electoral Commission SA does not publish information about candidates’ political platforms or policies.
Ballot paper order
| Position | Surname | Given name/s | Affiliation |
|---|---|---|---|
| 1 | BRAY | Frankie | Animal Justice Party |
| 2 | O'HANLON | Cressida | Australian Labor Party |
| 3 | McCUSKER | Katie | The Greens |
| 4 | FINIZIO | Anna | Liberal Party |
| 5 | HUSSEY | Nicole | Aust Family Party |